Grundy County’s workforce is motivated, experienced and high skilled with a labor pool of approximately 890,000 people within 30 minutes. Positioned in the middle of the three fastest growing counties, Kendall, Will and Grundy, the workforce is dynamic, growing, and energetic. Located just outside of the suburban traffic, Grundy County is attractive to residents looking for quality employment in manufacturing, logistics, energy, and healthcare.
Local employers consistently rank the Grundy workforce higher than the Midwest and national averages in key characteristics.

Why choose Grundy County to locate your business?
Here’s a few reasons why Procter & Gamble chose to locate in Grundy County in the fall of 2020.
Labor Force and Unemployment Rate 2024
| County | Labor Force | Employed | Unemployment Rate September 2024 | Unemployment Rate September 2023 |
|---|---|---|---|---|
| Grundy | 26,701 | 25,292 | 5.3% | 4.4% |
| Kankakee | 52,022 | 49,183 | 5.5% | 5.8% |
| Kendall | 73,899 | 70,542 | 4.5% | 4.0% |
| La Salle | 51,466 | 48,820 | 5.1% | 5.7% |
| Livingston | 16,727 | 16,056 | 4.0% | 4.1% |
| Will | 374,631 | 355,755 | 5.0% | 4.4% |
| State of Illinois | 6,533,877 | 6,207,010 | 5.0% | 4.7% |
(Source: Illinois Department of Employment Security)
Labor Force 2023 and Over the Years
| Year | Labor Force | Employed | Unemployed | Unemployment Rate |
|---|---|---|---|---|
| 2023 | 26,233 | 25,038 | 1,195 | 4.6% |
| 2022 | 26,492 | 25,191 | 1,301 | 4.9% |
| 2021 | 25,122 | 23,796 | 1,326 | 5.3% |
| 2020 | 24,269 | 22,138 | 2,131 | 8.8% |
| 2019 | 25,443 | 24,307 | 1,136 | 4.5% |
| 2018 | 25,504 | 24,284 | 1,220 | 4.8% |
| 2017 | 25,489 | 24,017 | 1,472 | 5.8% |
| 2016 | 25,722 | 23,999 | 1,723 | 6.7% |
| 2015 | 25,461 | 23,689 | 1,772 | 7.0% |
| 2014 | 25,614 | 23,370 | 2,244 | 8.8% |
| 2013 | 25,906 | 22,898 | 3,008 | 11.6% |
| 2012 | 25,754 | 22,796 | 2,958 | 11.5% |
| 2011 | 25,753 | 22,471 | 3,282 | 12.7% |
| 2010 | 25,954 | 22,506 | 3,448 | 13.3% |
| 2009 | 26,702 | 23,440 | 3,262 | 12.2% |
| 2008 | 26,237 | 24,348 | 1,889 | 7.8% |
Internship Program – Connecting Business and Future Employees
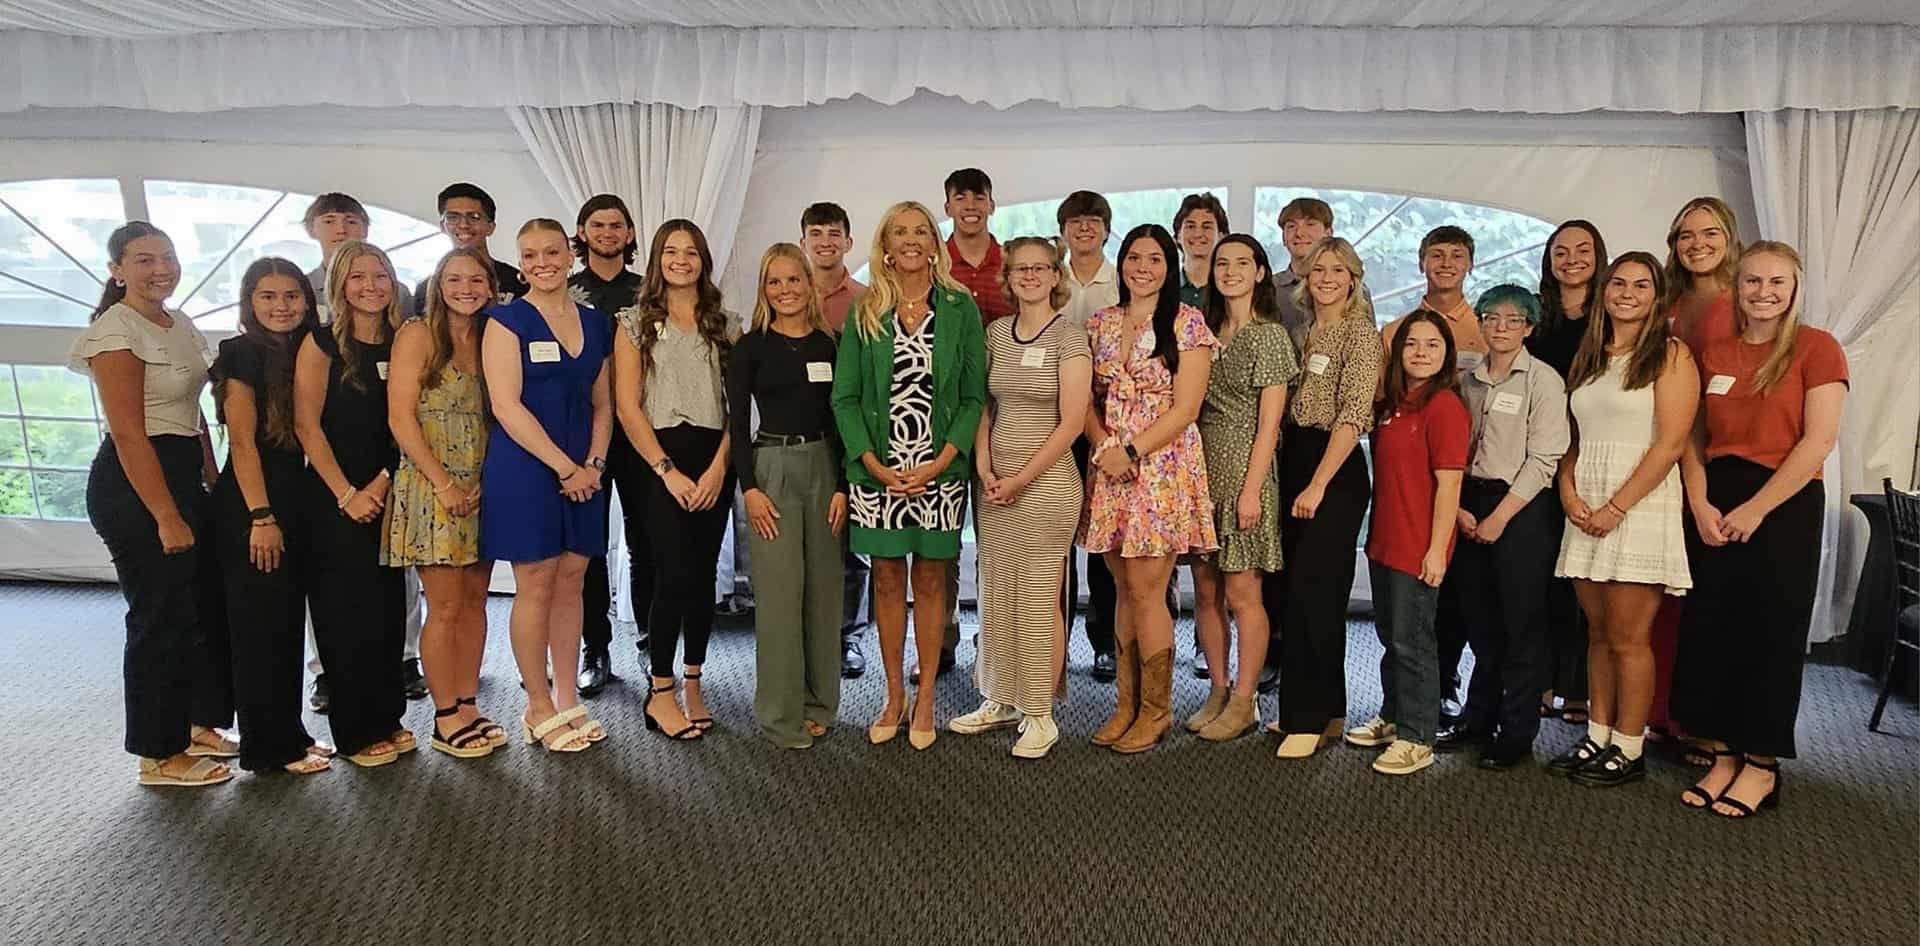
The summer internship program provides area businesses with a pipeline to Grundy County’s best and brightest students. Nearly 300 students have participated in the program over the last 12 years. Students can gain experience in a variety of fields including internships in IT, engineering, accounting, finance, marketing, HR, mechanical, and many more.

Intern Insights Interview Series
Listen in as some of the Grundy County Internship Program’s 2022 Interns describe their unique experiences, demonstrate their workforce readiness, and explain the value of the program to students and organizations alike. Organizations interested in participating in the Internship Program are encouraged to contact the GEDC office.
Grundy County Top 10 Occupations
| Employment by Occupation | 2023 Jobs | 2024 Jobs | Change | Male | Female |
|---|---|---|---|---|---|
| Transportation and Material Moving Occupations | 3,568 | 3,775 | 207 | 2,767 | 801 |
| Sales and Related Occupations | 2,553 | 2,627 | 74 | 1,212 | 1,341 |
| Office and Administrative Support Occupations | 1,975 | 2,007 | 32 | 429 | 1,545 |
| Management Occupations | 1,827 | 1,863 | 36 | 1,231 | 596 |
| Educational Instruction and Library Occupations | 1,763 | 1,806 | 43 | 353 | 1,410 |
| Food Preparation and Serving Related Occupations | 1,670 | 1,674 | 4 | 627 | 1,043 |
| Construction and Extraction Occupations | 1,468 | 1,482 | 13 | 1,436 | 33 |
| Healthcare Practitioners and Technical Occupations | 1,353 | 1,382 | 29 | 248 | 1,105 |
| Production Occupations | 1,273 | 1,299 | 26 | 1,018 | 255 |
| Installation, Maintenance, and Repair Occupations | 954 | 988 | 34 | 926 | 29 |
Age of Population
| Ages | Estimate | Percent |
|---|---|---|
| < 5 | 2,856 | 5.3% |
| 5-9 | 3,477 | 6.4% |
| 10-14 | 3,839 | 7.1% |
| 15-19 | 3,788 | 7.0% |
| 20-24 | 3,343 | 6.2% |
| 25-34 | 6,816 | 12.6% |
| 35-44 | 7,620 | 14.1% |
| 45-54 | 7,084 | 13.1% |
| 55-59 | 3,368 | 6.2% |
| 60-64 | 3,341 | 6.2% |
| 65-74 | 5,135 | 9.5% |
| 75+ | 2,771 | 5.1% |
| 85 years and over | 779 | 1.4% |
Grundy County Top 10
| Description | 2023 Jobs | 2024 Jobs | Change | Males | Females | Age 55+ % of Industry |
|---|---|---|---|---|---|---|
| Retail Trade | 4,006 | 4,143 | 137 | 2,119 | 1,887 | 14% |
| Government | 3,079 | 3,138 | 60 | 1,116 | 1,963 | 17% |
| Health Care and Social Assistance | 2,513 | 2,570 | 57 | 389 | 2,124 | 19% |
| Transportation and Warehousing | 2,267 | 2,445 | 178 | 1,601 | 666 | 18% |
| Construction | 2,309 | 2,312 | 4 | 2,051 | 257 | 18% |
| Accommodation and Food Services | 1,660 | 1,649 | (10) | 688 | 971 | 8% |
| Utilities | 1,312 | 1,335 | 23 | 1,040 | 272 | 16% |
| Manufacturing | 1,273 | 1,280 | 8 | 969 | 303 | 20% |
| Wholesale Trade | 774 | 818 | 45 | 581 | 193 | 19% |
| Other Services (except Public Administration) | 792 | 794 | 2 | 388 | 403 | 19% |

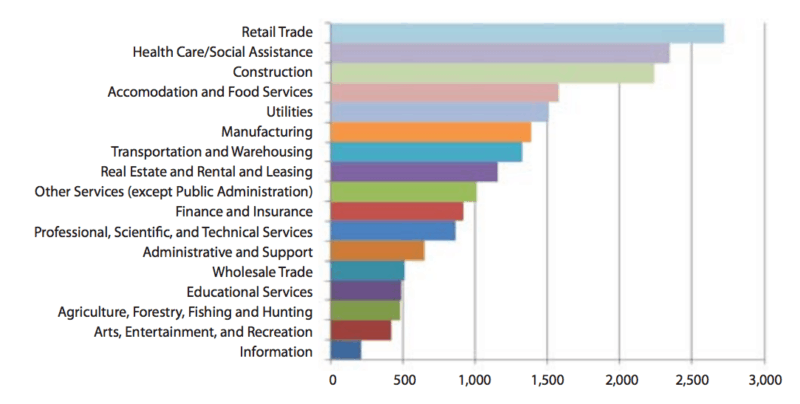
Grundy County Private Labor Force by Industry
Local Workforce Programs
Personalize Your Search
GEDC can also provide more in depth labor and workforce analysis through its subscription with Lightcast, a software firm that specializes in labor analysis. Contact the GEDC at [email protected] or 815-942-0163 if you have specific needs.

